Last week, I posted about my image binning technique This week, I have an even cooler follow up to that - an algorithm for converting images into contour maps (EG, something that looks like an topographic map). Yet again, rather than keeping you in suspense until the end, here is a sneak-preview of what kind of images you can produce using the technique described in this article:
Try adding your own image to play around with using the “Choose File” button, and use the slider to compare the original and modified images. (At the end, I’ll have another version of this with much more customizability)
In a purely mathematical sense, a contour line is just a function that can be plotted in 2D space, whose curve connects points that all have the same output value. Contour lines are used for a bunch of practical purposes in data visualization, such as in the context of topographic maps or for visualizing barometric pressure in weather fronts. Using topographic maps / contour lines has even been used to add a “cool” effect in user interfaces. Take this menu from Call of Duty, for instance.

In this article and the resulting code on GitHub, you’ll be able to apply this effect to arbitrary images. In doing this, I needed to figure out a way to make contour lines that looked like a “realistic” topographic map, yet also capturing the characteristics of the image in a meaningful way. There’s a thousand variations you could take on the algorithms for doing this - but here’s my take on it.
Drawing circles
In my implementation of this algorithm, all of the contour lines radiate out from a point. Thus, in thinking about this algorithm, it can help to start by thinking about just repeatedly drawing a bunch of circles on the canvas radiating out from the center. Something like this:
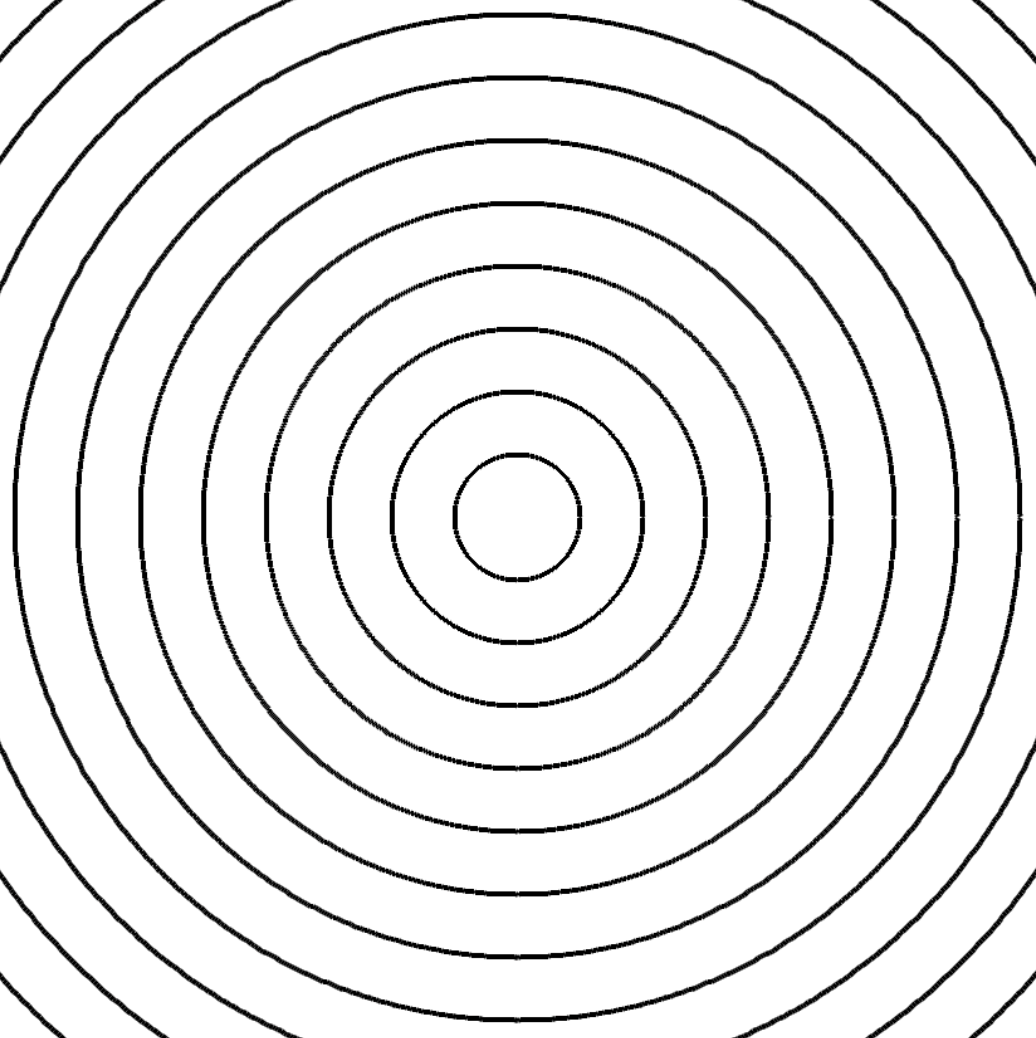
The algorithm to get something like this working is pretty simple, and could look something like this:
const ANGLES = 1080;

function draw_circle(context, radius, origin, lineWidth) {
  const FIRST = -1;
  let prevX = FIRST;
  let prevY = FIRST;
  for (let a = 0; a < ANGLES + 1; a++) {
    const angle = a / (ANGLES / 360);
    const Cosine = Math.cos(degreesToRads(angle));
    const Sine = Math.sin(degreesToRads(angle));
    const nx = Math.floor(origin[0] + radius * Cosine);
    const ny = Math.floor(origin[1] + radius * Sine);
    if (prevX == FIRST) {
      prevX = nx;
      prevY = ny;
    }
    drawLine(context, nx, ny, prevX, prevY, lineWidth);
    prevX = nx;
    prevY = ny;
  }
}

for (let i = 20; i < 1000; i += 20) {
  drawCircle(contextFromCanvas, i, [500, 500], 4);
}
The drawLine function, which is used here and will also be used later, is implemented using some built-in canvas context methods.
function drawLine(context, fromX, fromY, toX, toY, width) {
  context.beginPath();
  context.moveTo(fromX, fromY);
  context.lineTo(toX, toY);
  context.strokeStyle = "black";
  context.lineWidth = width;
  context.stroke();
}
This function over-complicates the problem a bit, as we could have leveraged the canvases arc function instead of using lines to draw the circles.
In this algorithm, we have an origin point to begin drawing circles from.
We choose some number of circles to draw, and for each the drawCircle function is given that circles radius.
For a given radius, we draw lines between points at a bunch of different angles, in this case 1080 angles.
Thus, these are not true circles, but merely a close approximation.
To give the topo effect to arbitrary images, I want to be in full control of how the contours are drawn, so doing it “manually” here with lines is worth it as a first step.
Making it look better
Just drawing a bunch of circles does not capture any of the characteristics of the underlying image. What I want to achieve is that darker areas of the image have lines closer together, and lighter areas have the contour lines spread farther apart. In this case, we are only capturing lightness levels, and not preserving any of the color (though, that would be an interesting thing to experiment with!). Let’s use the following image as an example:
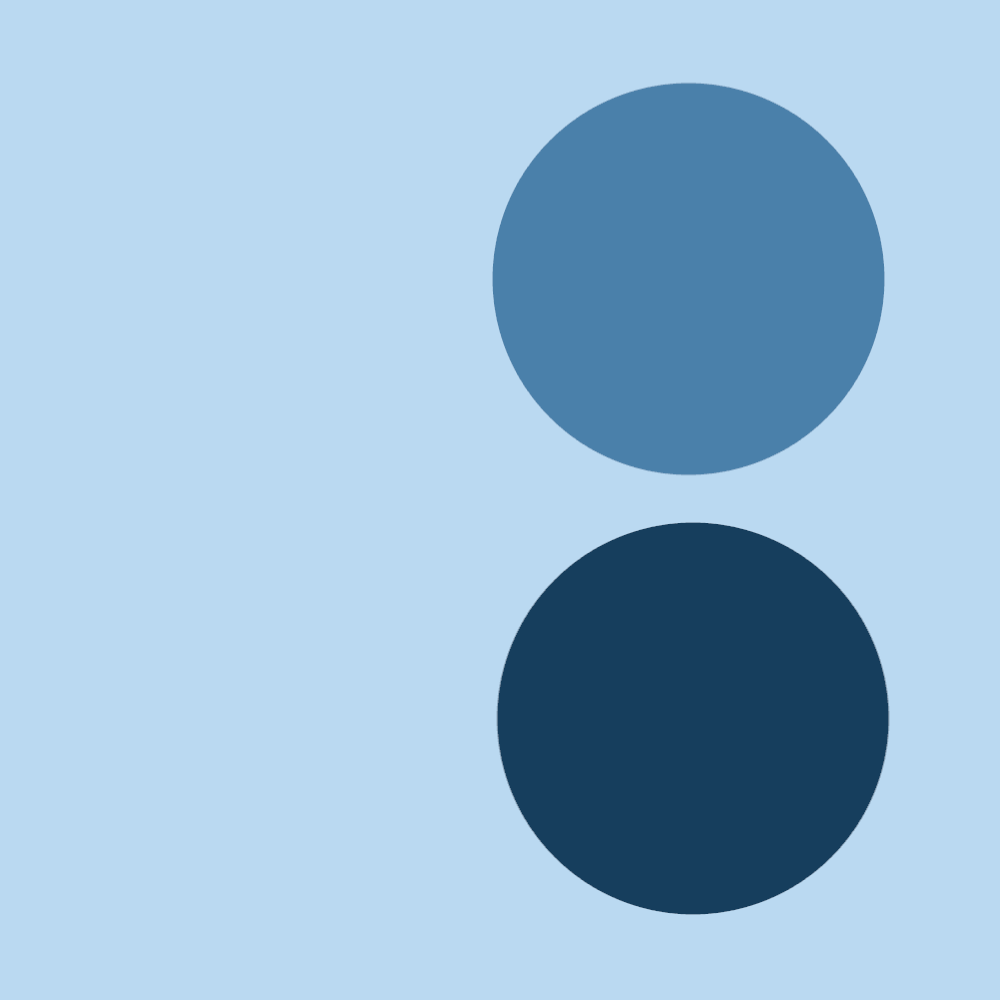
I want the contour lines to be “pulled in” on both of these darker blue circles, but more-so on the bottom one than on the top due to its darker shade. The goal is to achieve something like this:
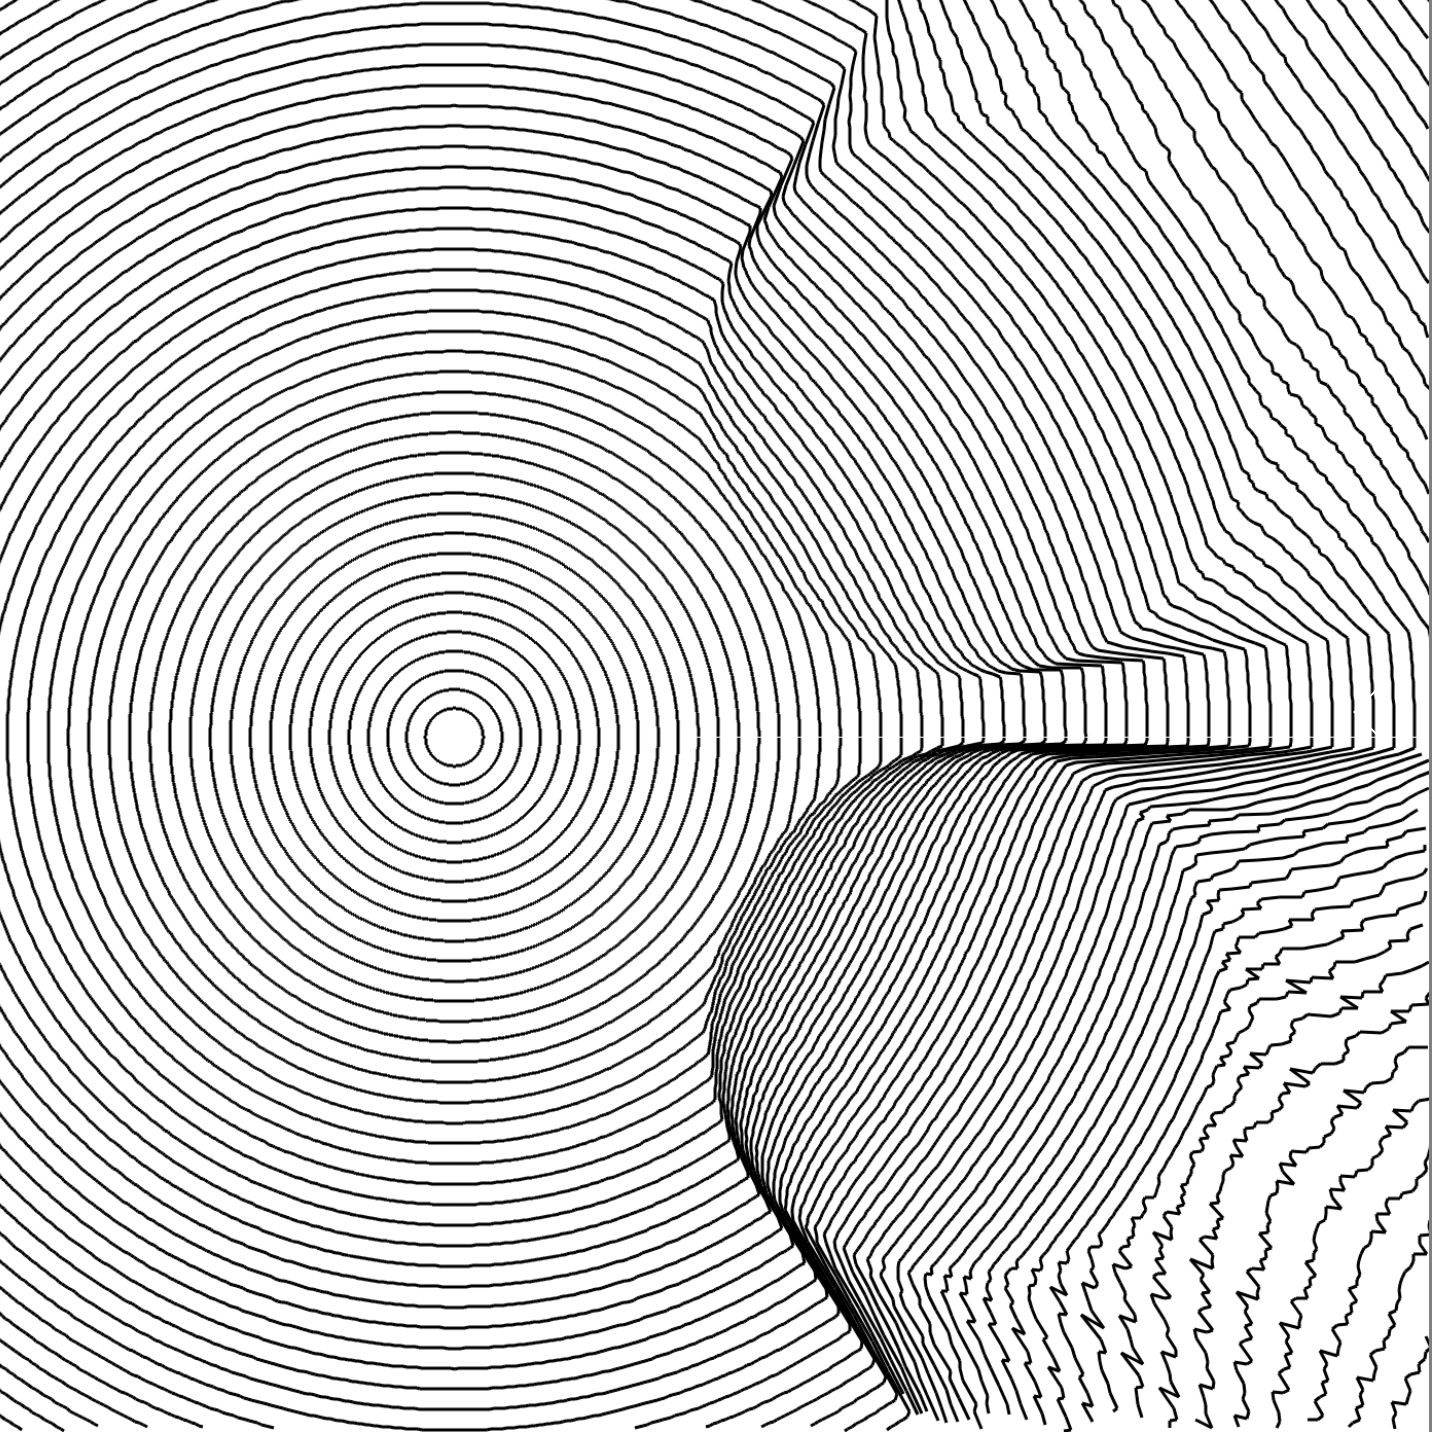
Notice that the lines get tighter on top of the darker circles, but as the lines exit the circle, they start to spread out much more. In some ways this does not look that great, but in my case it is an expected part of the algorithm. I want these contour lines to be continuous, other than when they exceed the boundary of the canvas. Because of this, if there is a light region that comes after a bunch of lines have been squished together in a dark region, the lines should be able to “catch back up” with the surrounding contour lines. Without this, the image would end up having dark sections that don’t necessarily correspond to darker image regions, giving a “stretching/tearing” look on the image.
To achieve this result, I have to make a few changes to the regular circle-drawing code from above.
I am no longer just going to be drawing perfect circles for each contour lines as it expands out from the origin.
As it expands, the amount each segment of each contour will be “pulled in” should depend on the brightness level of the underlying pixels from the original image.
Due to this, for a given circle being drawn, I will want the algorithm to remember all of the radii for each angle that was used in the previous iteration.
This will allow me to have one contour line to be influenced by the characteristics as the contour drawn before it.
For this, I keep track of all of the radii in a large array.
This will get returned from each call to drawContour (formerly drawCircle) and passed back in to the next call.
I also, of course, need to have the brightness level influence the spacing between contours.
To do this, I will incorporate the averageBrightnessBetween function.
This function allows me to pass in two radii (and several other bits of information) and then sample a few pixels between these two locations, and yield the average brightness of the samples.
This will be used to influence how far away the current line should be draw from the previous one.
Finally, the drawContour function:
function draw_circle(pixels, context, radius, origin, prevRadii, maxSpacing, lineWidth) {
  const radii = [];
  const FIRST = -1;
  let prev_x = FIRST;
  let prev_y = FIRST;
  for (let a = 0; a < ANGLES + 1; a++) {
    const angle = a / (ANGLES / 360);
    const Cosine = Math.cos(degreesToRads(angle));
    const Sine = Math.sin(degreesToRads(angle));

    // Get the radius at this angle from the previous contour line
    const prevRadius = prevRadii[a];
    const tempRadius = prevRadius + maxSpacing + (radius - prevRadius) / 7;

    // Get the average brightness between the previous radius and our new tempRadius
    const ab = averageBrightnessBetween(pixels, origin, Cosine, Sine, prevRadius, tempRadius);
    // This will be the new radius to use!
    // Get the (x,y) for it and add it to the to-be-returned radii list
    const newRadius = prevRadius + (tempRadius - prevRadius) * (ab / 255);
    const nx = Math.floor(origin[0] + newRadius * Cosine);
    const ny = Math.floor(origin[1] + newRadius * Sine);
    radii.push(newRadius);

    if (nx <= 0 || ny <= 0 || nx >= width || ny >= height) continue;
    if (prev_x == FIRST) {
      prev_x = nx;
      prev_y = ny;
    }
    drawLine(context, nx, ny, prev_x, prev_y, lineWidth);
    prev_x = nx;
    prev_y = ny;
  }
  return radii;
}
Using this function instead of drawCircle produces results like the one shown above for the two blue circles example.
There’s several variables that I’d like to give the end-user control of when using this image processing algorithm.
In the earlier example, there were two sliders - one for line spacing and another for line width.
There’s a bunch of other knobs that can be tweaked to get different interesting effects with the final image though.
For example, being able to control the origin point that the contours radiate out from, and the number of ANGLES that the algorithm uses to draw radiating out from this point.
In the example below, I provide more flexibility in controlling these variables.
Variations
This is just one way of doing things - there’s probably a bunch of other cool techniques you could use to achieve this contoured effect. If you come up with an alternate technique for this, write about it and let me know!
However, even for this specific algorithm, there’s a bunch of knobs that can be turned to change the result. Line width can be adjusted, spacing of the contours, origin point, etc. Thus, here at the end, I include a version that has a bunch of tunable parameters. Have fun!
The code
You can find the full solution here on GitHub. Please star / follow / leave a comment if you like it or have any questions.